
Editing a data infographic usually means retyping every label and number by hand. With the
Corporate Infographics Constructor in
AEJuice Pack Manager, you can just describe the data you want and let the AI fill the whole chart.
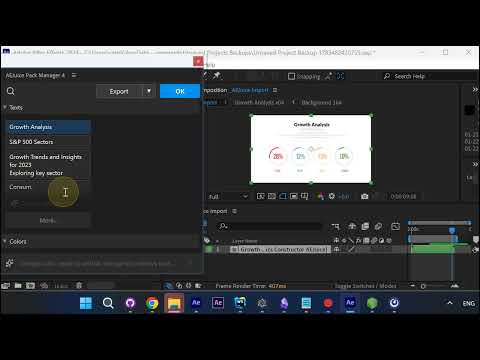
A ready-made Growth Analysis chart
Drop in the Growth Analysis infographic — four animated percentage rings, ready to customize. Open its
edit dialog and you’ll find every title, label, and value in the Texts section.
Describe the data you want
Instead of typing each number, use the Describe what to change box at the bottom of the dialog. Type
a prompt like “display the 4 main sectors of the S&P 500 in %” and send it — the AI goes to work.
The AI fills the chart
The AI rewrites every sector for you — Consumer, Financials, Health, and IT — each with a real
percentage on its ring. From there you can fine-tune any value, set the font, or recolor a sector.
Get it
The AI infographic editing lives in the Corporate Infographics Constructor,
browsable and importable straight from AEJuice Pack Manager.
Also part of Pack Manager: https://aejuice.com/product/pack-manager/?utm_source=aejuice_forum&utm_content=ai-fill-infographic-data-after-effects